Unified engineering workbench
The workbench uses the owner-provided brand kit: one project shell, persistent engineering tabs, two tool drawers, bundled fonts, and shared light/dark tokens. Conversation and Inspect arrange the same Ask session and views. Moving a tab retains its renderer/editor instance; closing a view does not cancel a job.
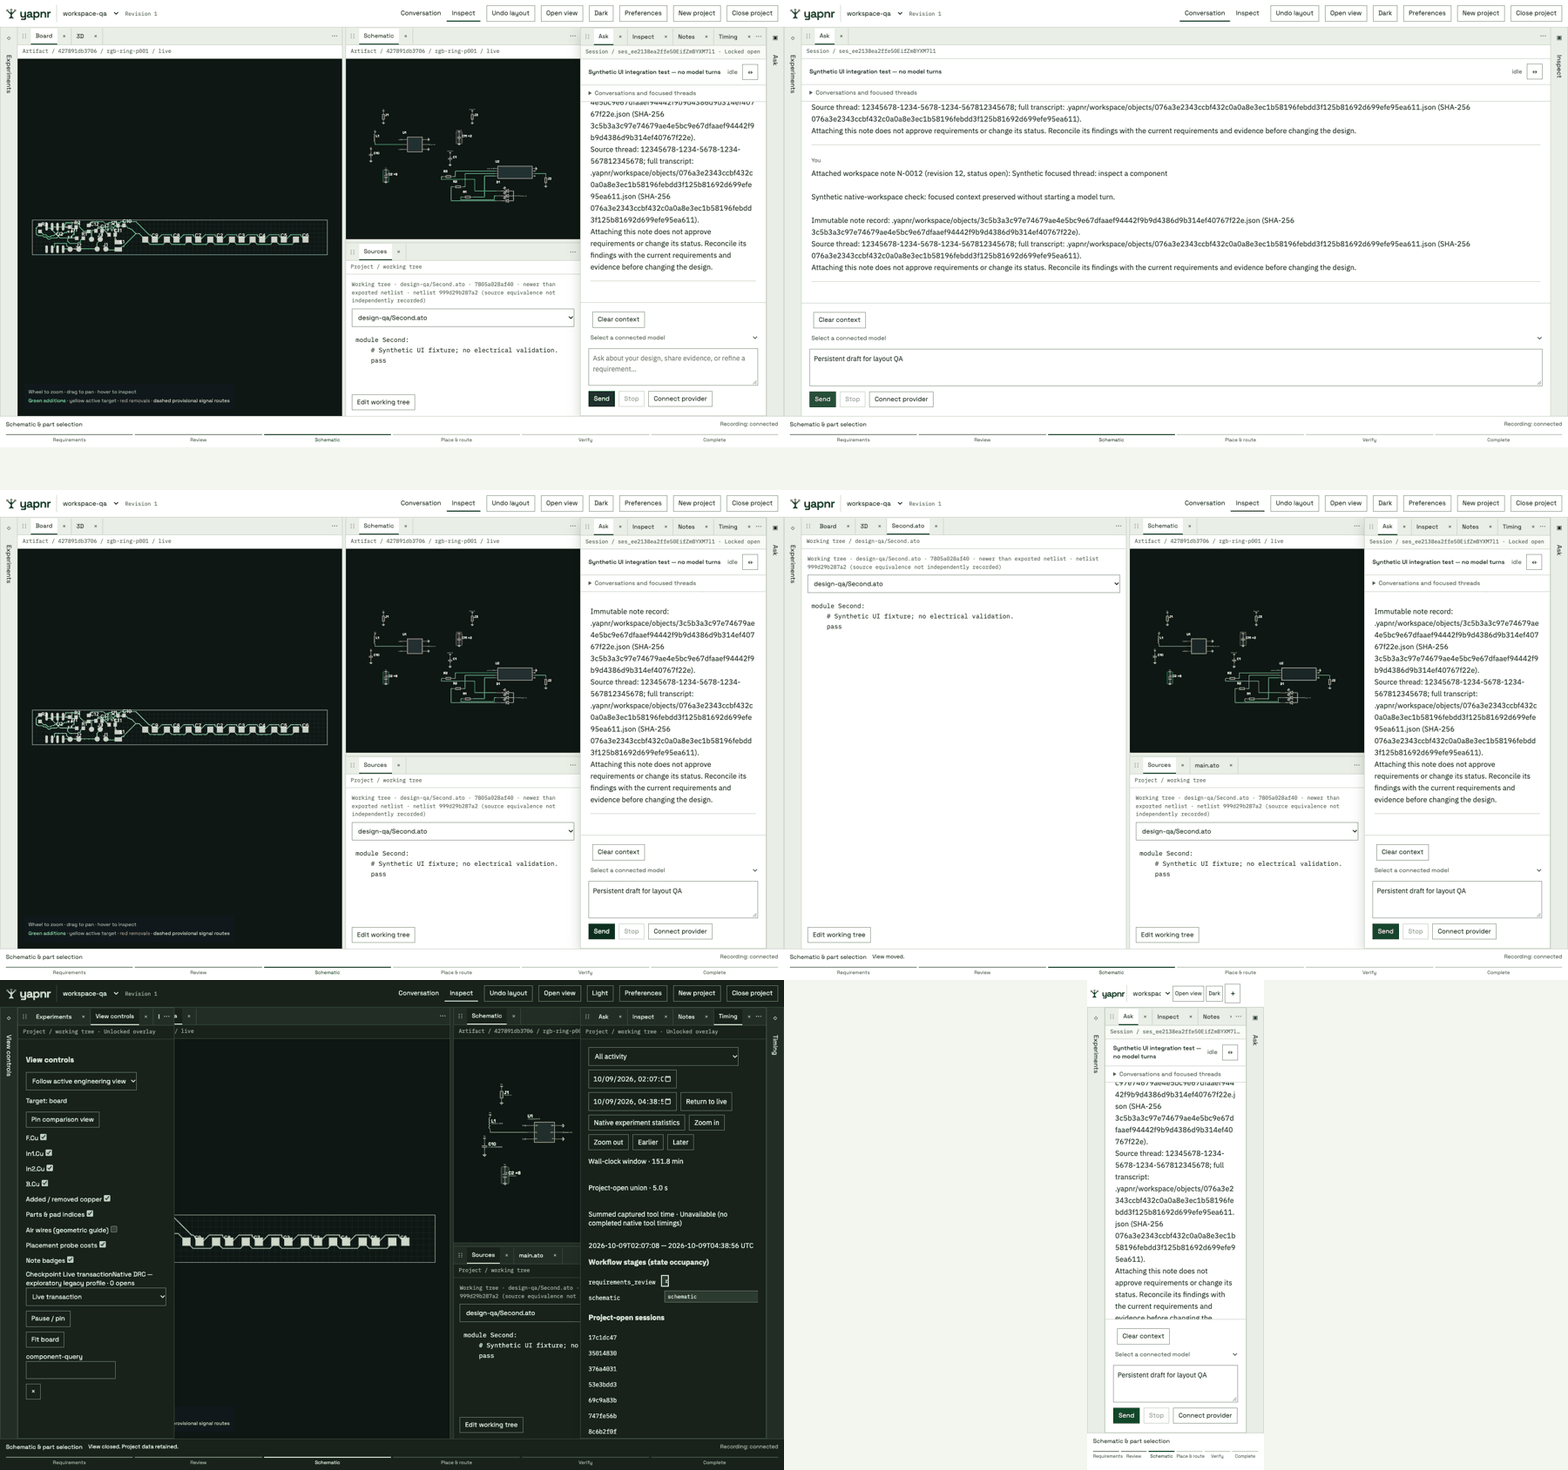
This capture exercises the packaged UI against a synthetic conversation and source fixture. Board and schematic views show an existing recorded LED-ring experiment. The fixture sources are independent of that experiment; the UI labels their hashes separately. No model turn, acceptance or electrical validation was performed by this walkthrough. Images are UI evidence, not DRC evidence.
Checked behavior includes two source-file tabs, pointer merge across an iframe, Escape rollback, dirty-close Cancel/discard, minimize/original-slot restore, retained Ask draft and renderer load count, unsaved source recovery after reload, unlocked drawer dismissal, Notes, recorded timing and stable historical selection during refresh, light/dark and opaque overlays. Viewports 360, 900, 1360 and 1600 have no page overflow; the 800-pixel layout projection was checked at twice the device scale.
The dock transaction tests cover four split directions, ordered group moves, drawer reorder/migration, last-pane recovery, presets and invalid destinations. Backend tests cover source concurrency, managed-file boundaries, lifecycle idempotence, missing closes, overlapping sessions, late heartbeats and deduplicated parallel tool spans. Native experiment statistics remain a separate Timing view.
Source-to-build equivalence and CPU measurements are unavailable where the workspace did not record them. Linked highlights reject unknown or mismatched artifact hashes. Touch hardware, screen-reader behavior and a sustained 60 fps performance benchmark have not been certified by these checks.
Drawer motion and source navigation
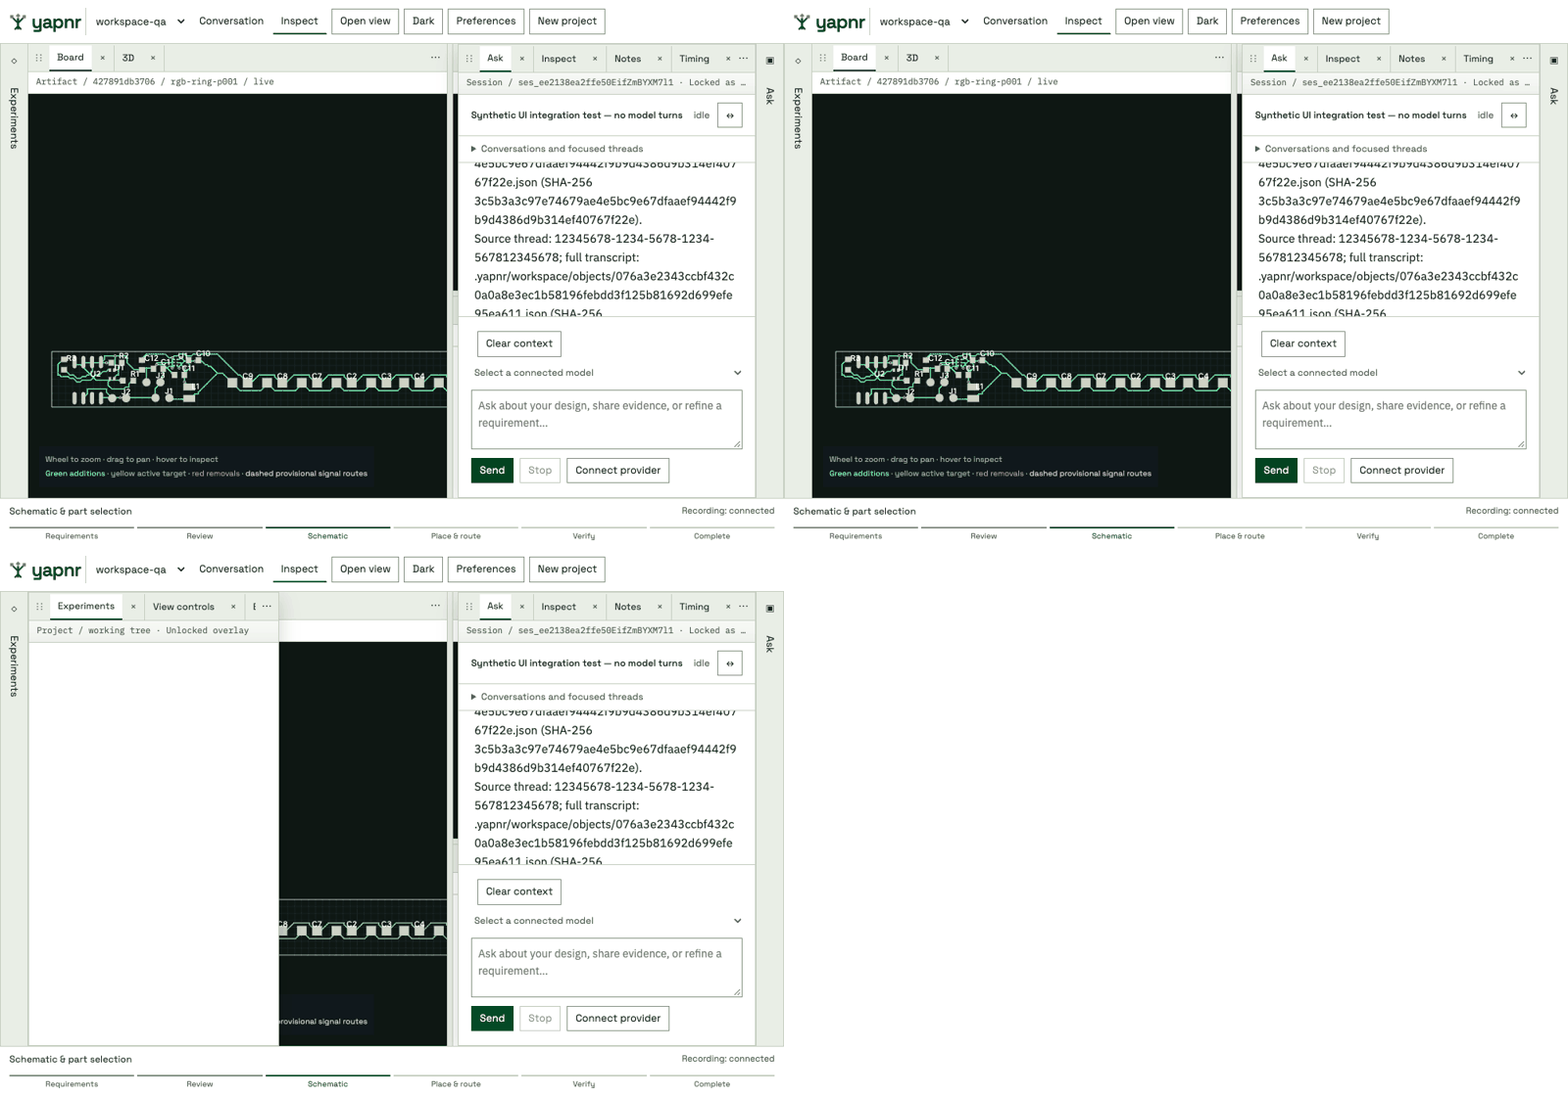
The synthetic fixture shows the actual 180 ms drawer transitions. Drawer contents stay mounted while closing, rapid reopening cancels the prior motion, and reduced motion uses immediate visibility changes. This capture is a UI demonstration, not an electrical verification.
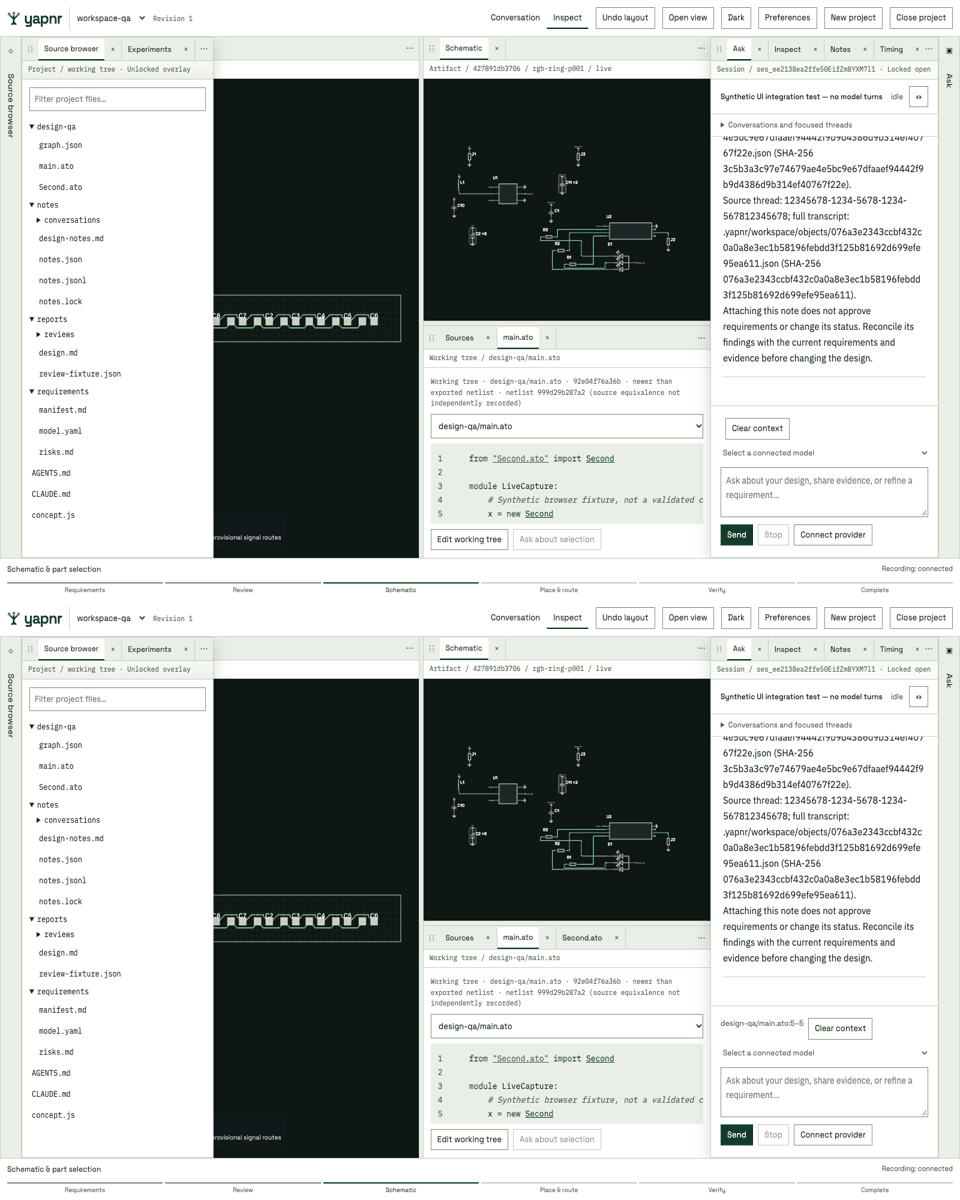
The source tree starts in the left drawer and preserves directory expansion while files update. Non-Atopile text files are read-only; binary and oversized files are rejected rather than decoded as source.
Source reads use syntax-colored Atopile text with line numbers. Resolved project imports open source tabs; managed imports use the existing read-only native source browser and its module index. Selecting text enables Ask about selection, which attaches immutable file/line/text and working-tree/buffer hashes. Unsaved edits are explicitly marked as drafts. No selection itself submits a model turn.
Native experiments and artifact provenance
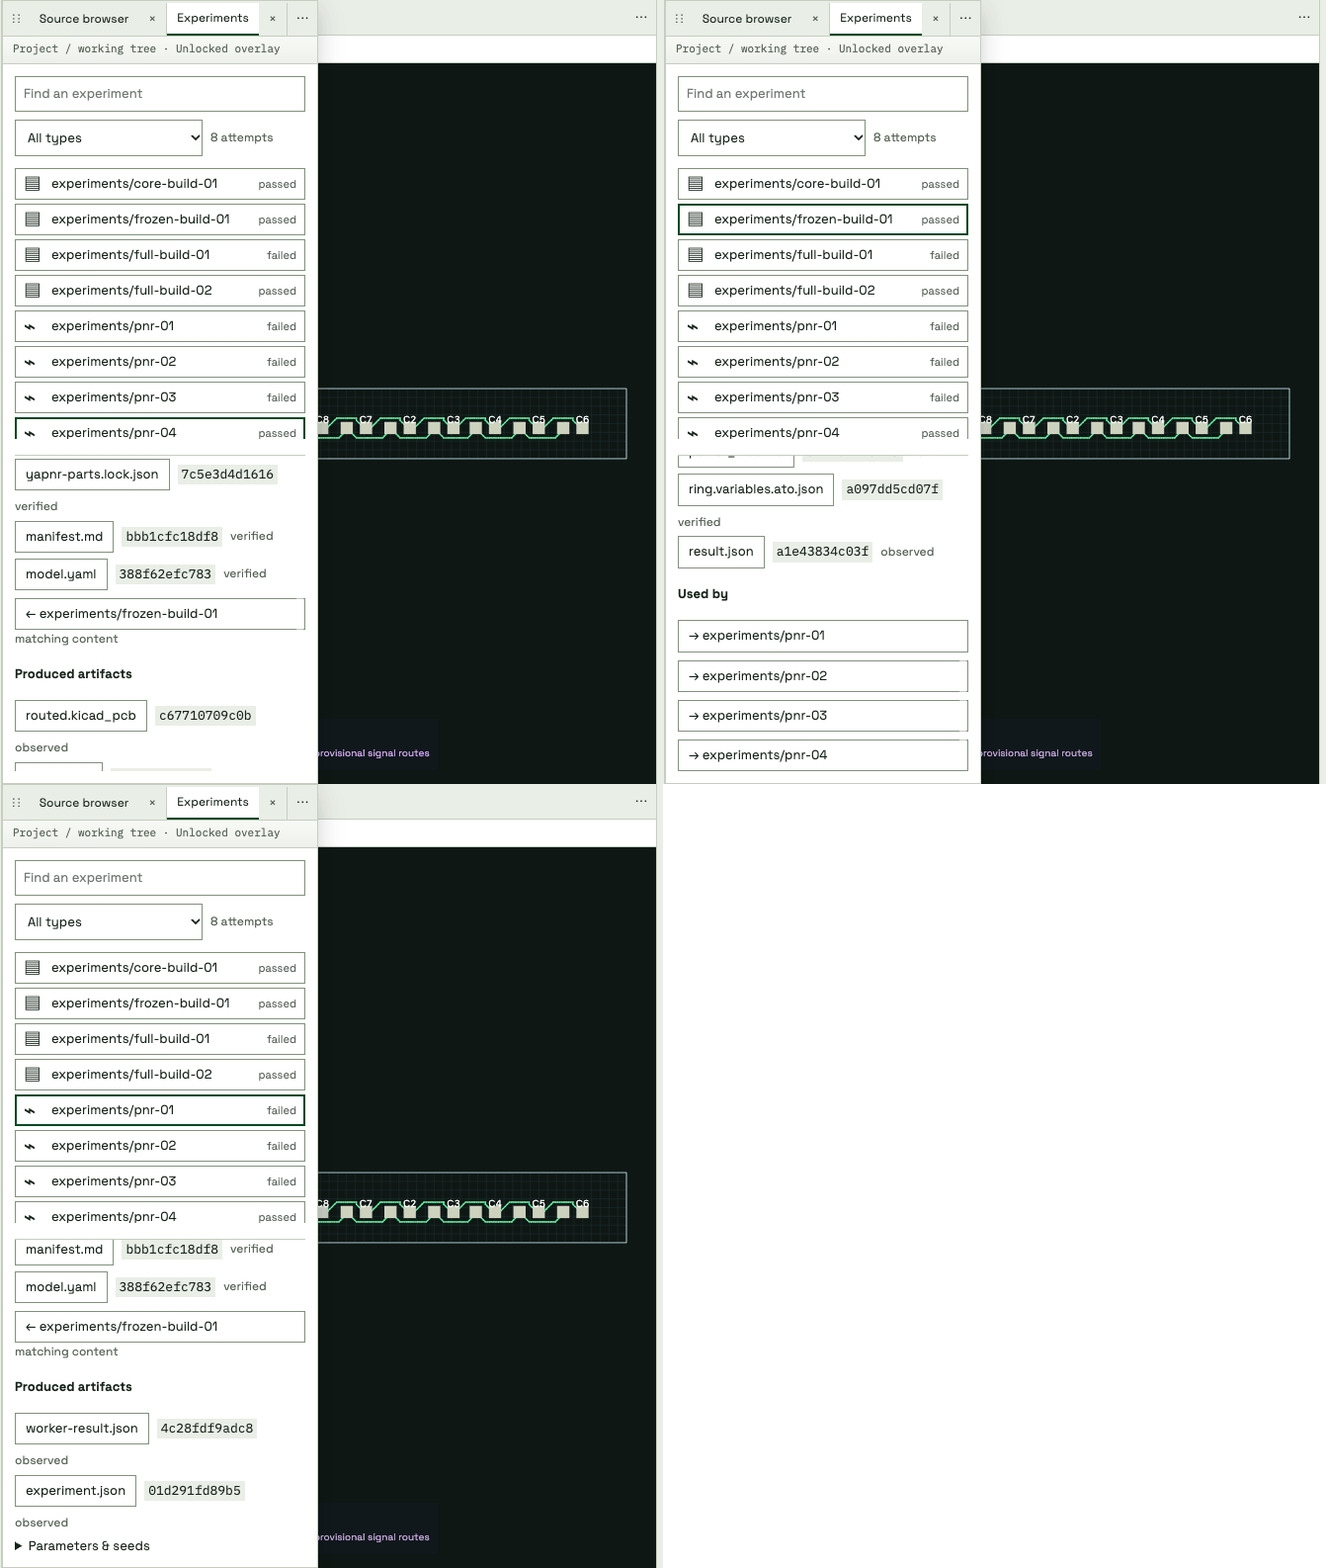
Experiments is a native workbench tree, without the legacy experiment-browser iframe. Failed attempts remain visible, with icons and filters for discovery, part picking, schematic builds, PCB placement/routing, simulation and validation. Selecting an attempt exposes its captured inputs, produced artifacts, parameters and seeds. Content hashes establish navigable upstream and downstream links; missing historical input evidence stays explicitly unknown. Registered attempts capture immutable inputs and outputs in the workspace artifact store.
The capture uses the existing LED-ring schematic build and PnR reports. The PnR input hash matches the frozen schematic PCB output. This illustrates recorded lineage, without claiming electrical qualification of the board. Opening the drawer initializes Experiments immediately, without switching tabs. Selecting a recorded routing lane updates the existing Board, Schematic and 3D surfaces.
Floating workspace search and performance settings
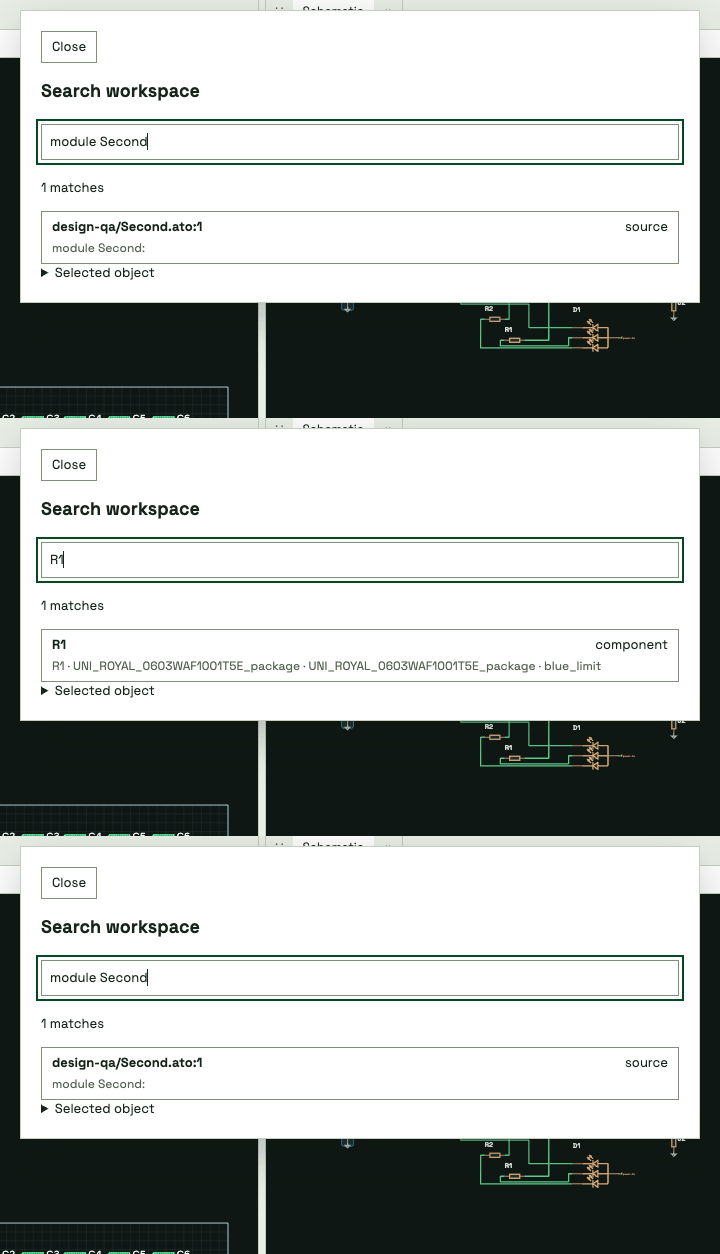
Cmd-F or Ctrl-F opens workspace search, including from embedded renderer frames. Reopening retains the query; repeating the shortcut while open clears it. Matching source lines open their files, and components/nets reveal through the existing artifact-hash checks. Selected-object metadata, pin tables and vendor/datasheet links remain available in the dialog. Inspect is removed from saved tab layouts. The capture combines synthetic source text with an existing recorded component, without asserting source-to-board equivalence or electrical validation.
Performance has its own tab. Native routing controls retain their existing safe boundary/restart choices. Google Cloud Batch settings use the engine’s validated configuration and save to the project, with optimistic concurrency. SDK profiles and authentication status are read from the UI host; credentials and credential lookup commands are not copied into workspace artifacts. The execution environment must have the corresponding SDK credentials. Saving settings launches no jobs.